1. 커널 SVM이란
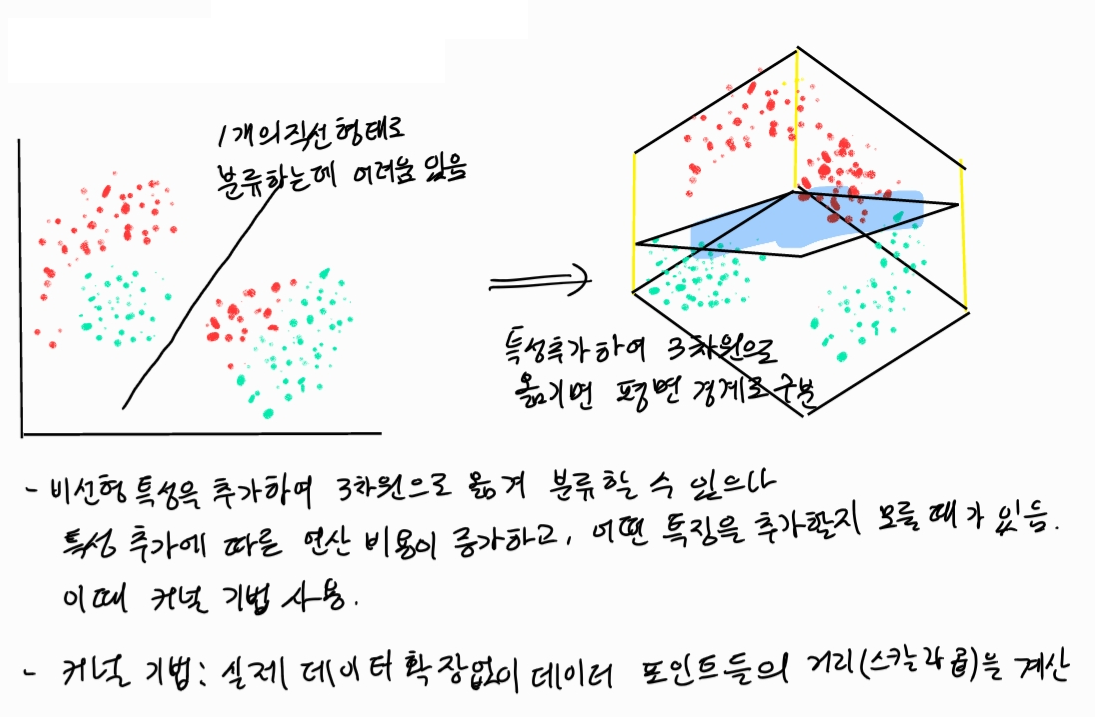
- 앞서 SVM 포스트에서는 선형 SVM을 중심으로 다뤘다. 그러나 실제로 선형 SVM으로 분류하기 어려운 데이터 형태들도 있다.
커널 기법의 기본적인 아이디어는 데이터를 높은 차원으로 이동시켜 고차원 공간에서 데이터를 분류하고자 함이다.

2. 듀얼 형태 변형
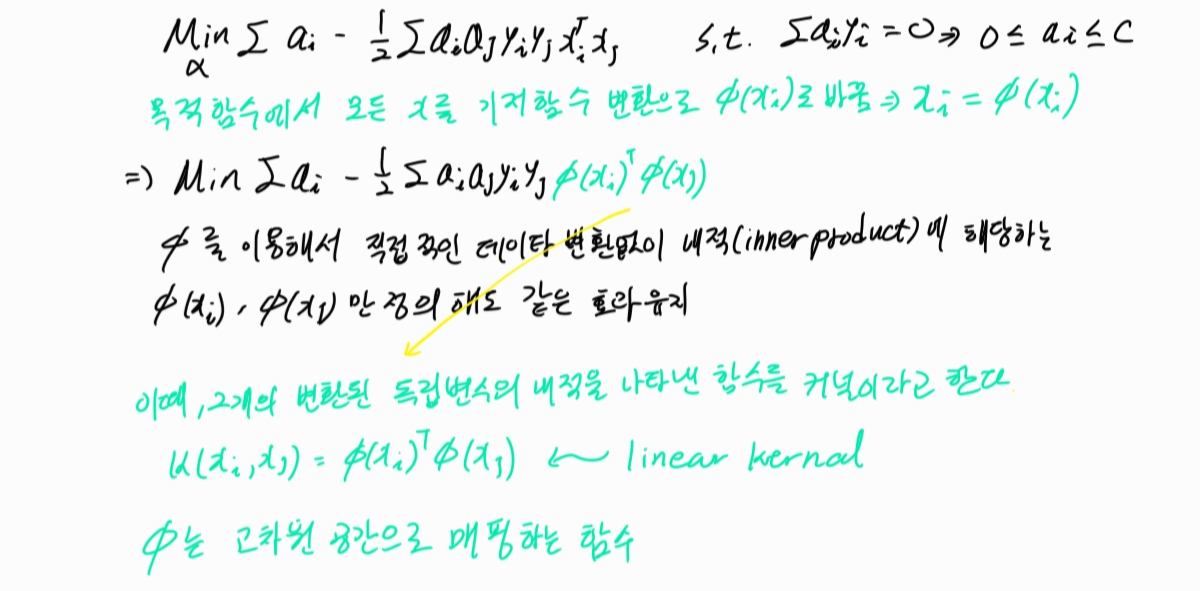
- 지난 SVM 포스팅에서 듀얼 형태를 다룬 적 있다. 듀얼 형태를 변형시켜 커널 SVM에서 활용할 수 있다.


** 커널의 의미

3. 커널SVM 종류
1) 선형 SVM : K(x1,x2)=x1.T*x2
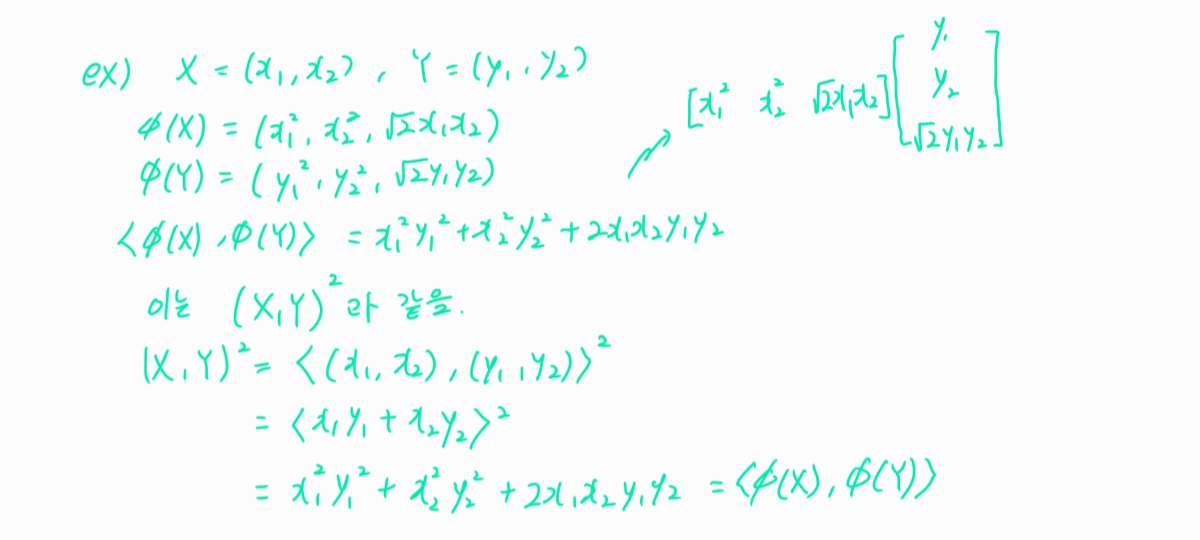
2) 다항식 커널

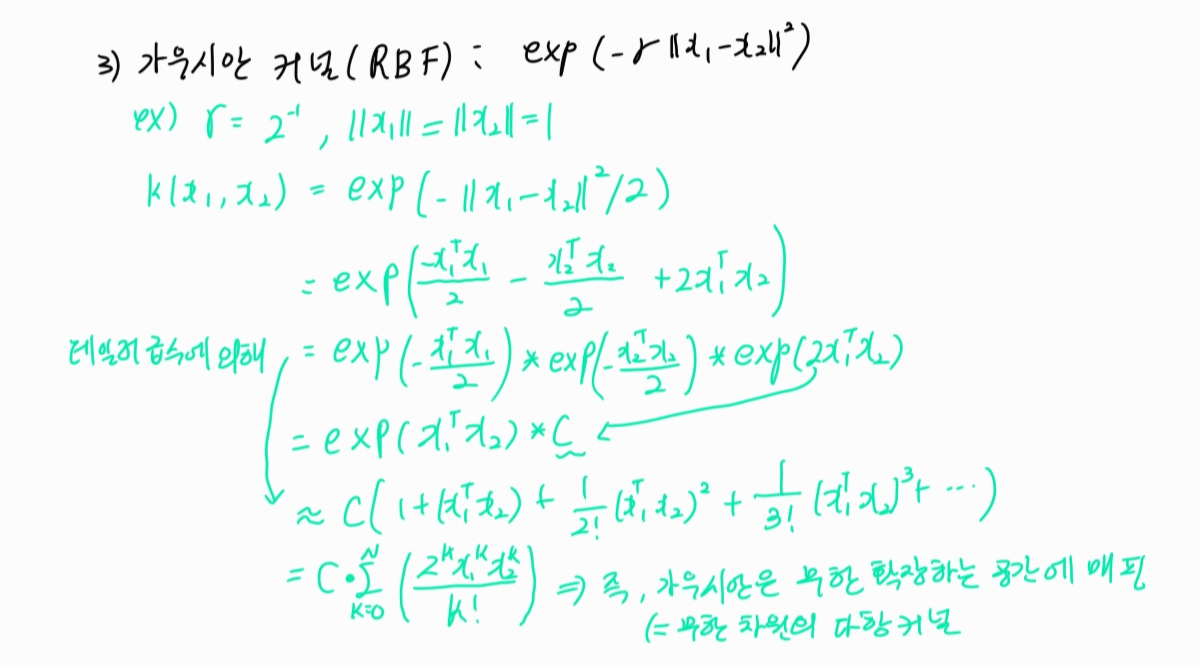
3) 가우시안 커널 : 성능이 우수하여 가장 많이 쓰이는 기법.

4) 시그모이드 커널 SVM : K(x1,x2)=tan(r(x1.T*x2)+theta)
4. SVM 예제 적용
[붓꽃 문제]
scikit-learn의 SVM 클래스는 kernel 인수를 지정하여 커널을 설정할 수 있다.
1) kernel = "linear": 선형 SVM.
2) kernel = "poly": 다항 커널.
- gamma
- coef0
- degree
3) kernel = "rbf" 또는 kernel = None: RBF 커널.
- gamma
4) kernel = "sigmoid": 시그모이드 커널.
- gamma
- coef0
1-1) 라이브러리 준비
import numpy as np
import pandas as pd
import matplotlib.pyplot as plt
from sklearn.svm import SVC
from sklearn.preprocessing import FunctionTransformer
1-2) 데이터셋 마련
from sklearn.datasets import load_iris
from sklearn.model_selection import train_test_split
from sklearn.preprocessing import StandardScaler

# 데이터 셋
iris =load_iris()
#['sepal length (cm)','sepal width (cm)','petal length (cm)','petal width (cm)'] 타겟 외 컬럼
X=iris.data[:,[2,3]]

# 타겟 컬럼
Y=iris.target
X_train,X_test,Y_train,Y_test=train_test_split(X,Y,test_size=0.3,random_state=0)
1-3) 스케일링
# 스케일링 & 정규화
sc = StandardScaler()
sc.fit(X_train)
X_train_std=sc.transform(X_train)
X_test_std=sc.transform(X_test)
X_combined_std=np.vstack((X_train_std,X_test_std))
Y_combined_std=np.hstack((Y_train,Y_test))
2) 모델링
# 모델링
## 선형 SVM
model1=SVC(kernel='linear').fit(X_test_std,Y_test)
## 다항 커널SVM
model2=SVC(kernel='poly', random_state=0,gamma=10,C=1).fit(X_test_std,Y_test)
## 가우시안 커널SVM
model3=SVC(kernel='rbf',random_state=0,gamma=1,C=1).fit(X_test_std,Y_test)
3) 모델 결과 및 시각화
## 시각화 함수
def plot_iris(X,Y,model,title,xmin=-2.5,xmax=2.5, ymin=-2.5,ymax=2.5):
    XX,YY=np.meshgrid(
        np.arange(xmin,xmax,(xmax-xmin)/1000),
        np.arange(ymin,ymax,(ymax-ymin)/1000))
    ZZ=np.reshape(model.predict(np.array([XX.ravel(),YY.ravel()]).T),XX.shape)
    plt.contourf(XX,YY,ZZ,cmap=plt.cm.Paired_r,alpha=0.5)
    plt.scatter(X[Y == 0, 0], X[Y == 0, 1], c='r', marker='^', label='0', s=100)
    plt.scatter(X[Y == 1, 0], X[Y == 1, 1], c='g', marker='o', label='1', s=100)
    plt.scatter(X[Y == 2, 0], X[Y == 2, 1], c='b', marker='s', label='2', s=100)
    plt.xlim(xmin, xmax)
    plt.ylim(ymin, ymax)
    plt.xlabel("sepal length")
    plt.ylabel("sepal width")
    plt.title(title)

plt.figure(figsize=(8, 12))
plt.subplot(311)
plot_iris(X_test_std, Y_test, model1, "Linear SVC")
plt.subplot(312)
plot_iris(X_test_std, Y_test, model2, "Poly kernel SVC")
plt.subplot(313)
plot_iris(X_test_std, Y_test, model3, "RBF kernel SVM")
plt.tight_layout()
plt.show()
'Data_Analysis > MachineLearning' 카테고리의 다른 글
| [Machine Learning] SVM(Support Vector Machine) (0) | 2020.12.28 |
|---|---|
| [Machine Learning] NLP - 텍스트처리(Tokenize) (0) | 2020.10.31 |
| [Machine Learning] Ensemble - Random Forest (0) | 2020.07.24 |
| [MachineLearning] Decision Tree(의사결정트리) (1) | 2020.07.23 |


댓글